Being a part of any tech startup takes hard work and if you’re in the C-suite, you may feel like fundraising is a never-ending thing. Further, having a great pitch and brand story is just part of the larger picture. It takes more than that to really get the round of funding you need while also making sure that the health of the business continues to grow.
When it comes to making an investment in a company, board members and investors are largely concerned about the numbers. It makes sense, given that profits don’t come from emotion or creativity alone.
Marketers have their work cut out for them when trying to appeal to investors and boards because the two groups often speak different languages. But if you want to earn C-suite approval, you’ll need to learn how to translate the results of your executions into cold, hard metrics that executives actually care about.
This means knowing specific metrics and KPIs that aren’t just marketing focused, but rather illustrate how marketing activities are impacting the overall business objectives and allowing a company to thrive in the market. Or in other words, you’ll need to convert your marketing metrics into financial ones.
First, What Do Investors Care About?
Before we dive into the specific metrics, it’s important to know what investors and executives prioritize (hint: it’s usually not the same as what excites us marketers).
The C-suite wants to know all about the size of their addressable market. They want to know what it’s costing them to do business, what they’re spending to gain new customers, how long those customers are staying, how much they’re spending, and the total value they bring to the company. They want to know how they stack up in the market compared to competitors.
This is what marketers care about to an extent, but these aren’t things we usually need to worry about. Our role as marketers focuses on whether our activities are working. We get a tingle when we see our conversion rates growing and shout with glee when customers return. All of that financial analysis is often left to the higher-ups.
But if you want their buy-in (and funds), you’ll need to care about the financial side of marketing and support your claims that your ideas are worth something.
Let’s look at five of the KPIs and metrics you should be tracking that can help you make a compelling case to investors and C-suite executives:
1. Customer Acquisition Costs
Customer Acquisition Cost (or CAC) is the sum of all of your marketing spend, salaries, commissions, bonuses, and overhead in a given time frame. This total is divided by the number of new customers that you earn within that same time frame.
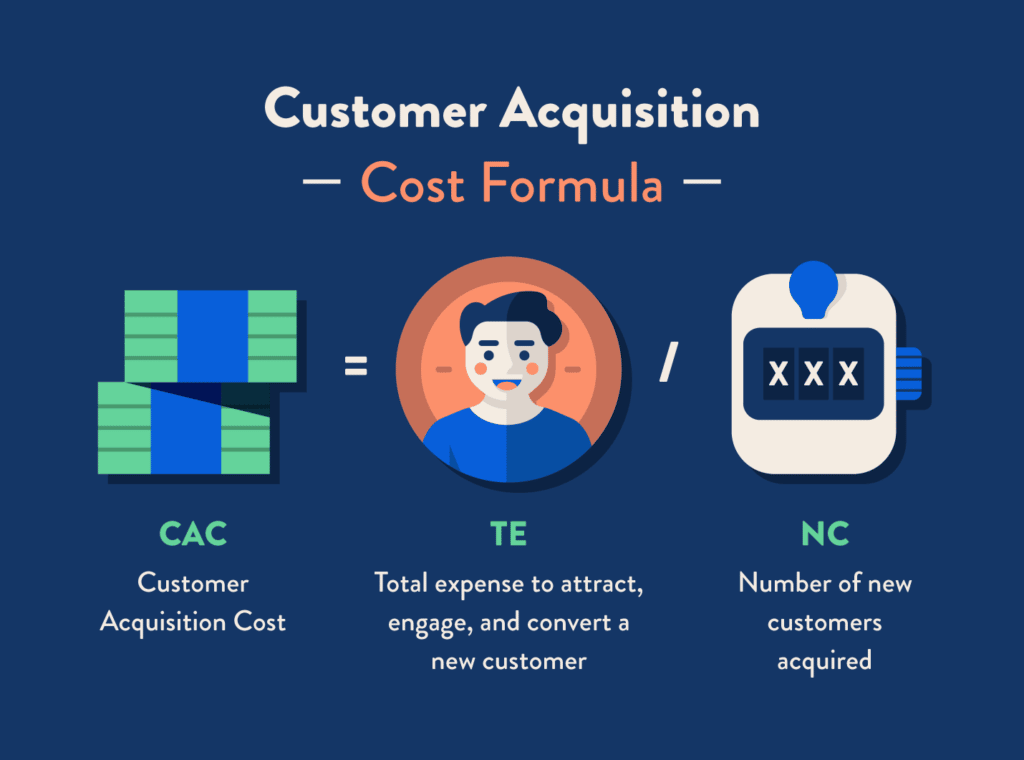
Let’s say you’re spending $10,000 on advertising in a month, and your salaries, overhead, commissions, and bonuses are about $15,000 a month. That’s a total of $25,000.
Now, let’s say you get 100 new customers that month. Your total CAC is $250.
CAC isn’t a metric that can stand alone, at least when appealing to the C-suite. You want to show how CAC fits in with other business objectives and offer perspective as to whether that CAC is a reasonable figure or if it’s too high.
Using the $250 CAC example, that would be a really great price if your customer is spending $10,000 in a year and maintains their service with you for 5+ years. You’d make your money back almost instantly! But if you’re spending $250 to acquire a customer for your retail store and they only spend $100 a year, you’re waiting at least 30 months before you ever break even, and that doesn’t include the cost of goods (COGs).
2. Customer Revenue
Customer revenue is the amount of money a customer brings to your business in a given time frame (usually on a monthly or annual basis). Investors don’t just want to see the number of new customers, but rather how much they’re contributing to the bottom line.
Think about it this way: you could gain 100 new customers that each spend $10 with your company, or you could get 50 new customers that each spend $100 with your company. Which group would you rather have?
Again, customer revenue metrics need to be put into perspective. Show how they relate to customer acquisition and overall growth, especially in terms of growth rate.
3. Total Customer Lifetime Value
Repeat customers build value over time. The longer they remain with your service or the more they buy from you, the greater their customer lifetime value.
To calculate this metric, take their average purchase value and multiply that number by their average purchase frequency. Then, multiply that amount by the average customer lifespan. Here’s how this looks:
The average customer purchases your $99 subscription service and retains your service for an average of 5 years. In this case, your total customer lifetime value is $5,940 (the amount of money they spend with your company over the course of their lifespan).
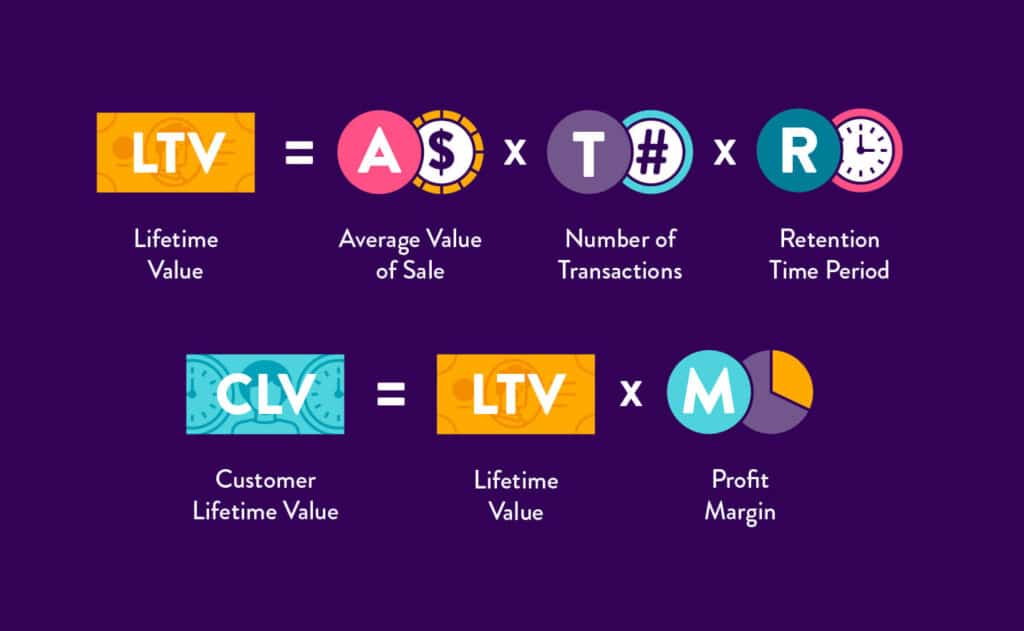
You could take this metric a step further by subtracting your cost of goods from the equation to see each customer’s profitability. Another factor you might consider is when customers cancel service, and then reactivate. Their lifetime value shouldn’t start over, but rather continue building from where they left off.
4. Customer Retention & Churn
Customer retention metrics indicate the quality of the customer you attract. The longer the customer stays, the less it costs you to generate revenue and the more profitable your marketing efforts will be.
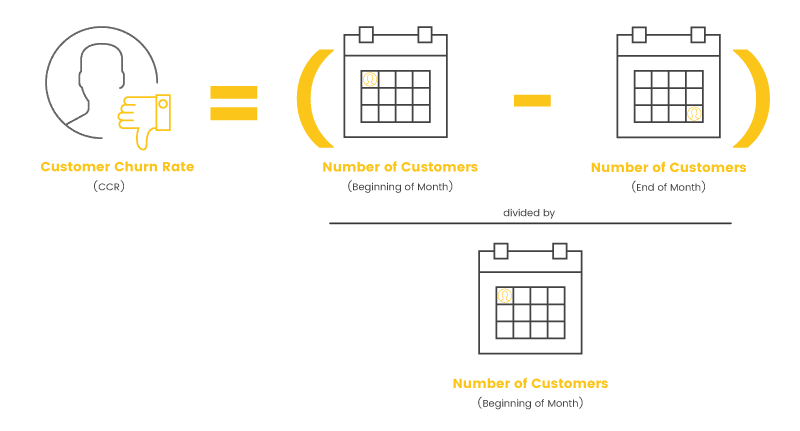
If you’re continually cycling through customers, you’re essentially spending more to make the same profit you could make if you could retain customers.
C-suite and investors care about customer retention because it ultimately lowers their costs per customer.
On the flip side of things, understanding churn is important as well. In fact, being able to represent the “stickiness” of your product is one thing, but then being honest about the churn rate is key to understanding where you may need to make product/service enhancements to grow.
5. Marketing Originated or Influenced Customer Percentage
Marketing originated and marketing influenced ratios show what percentage of your new business is directly related to your marketing activities. Marketing originated percentages are calculated by dividing the number of new customers that responded to a marketing campaign in a period by the total number of new customers in that same period.
Marketing influenced customers are those that make a purchase after being nurtured by marketing campaigns at some point in the journey. In other words, marketing played a role, but may not have originated from the lead.
In both cases, you can look at the ratio of customers or of the total revenue, whichever makes more sense for your business.
Bottom line: turning the heads of investors and executives takes its own genre of marketing. You want to appeal to their needs and interests to get an optimal outcome, and that’s something that marketers already inherently know how to do.
Final Thoughts
Be concise with the metrics you present on. You want to show the growth of your product/service, but also paint an adequate picture of why another round of investment would help elevate growth initiatives, too.
Finally, be sure to also have reporting readily available that shows the week over week, month over month, and year over year growth. These reports can be used both internally and then externally when fundraising or reporting to the board as well.